Manager Reports
The Reports page answers two questions. First: how is the team doing right now — how many tasks overdue, how much completed, who is carrying the heaviest load? Second: how is one specific person doing — their overdue work, their completed history, the trend across the past twelve periods?
Two views handle those two questions. Both have an Export to Excel button. Both are RBAC-defended, so nobody sees a person they don't manage, and nobody exports data outside their own reporting chain.
The Team Dashboard view
Open Manager Reports from the left sidebar. The default landing is the Team Dashboard.
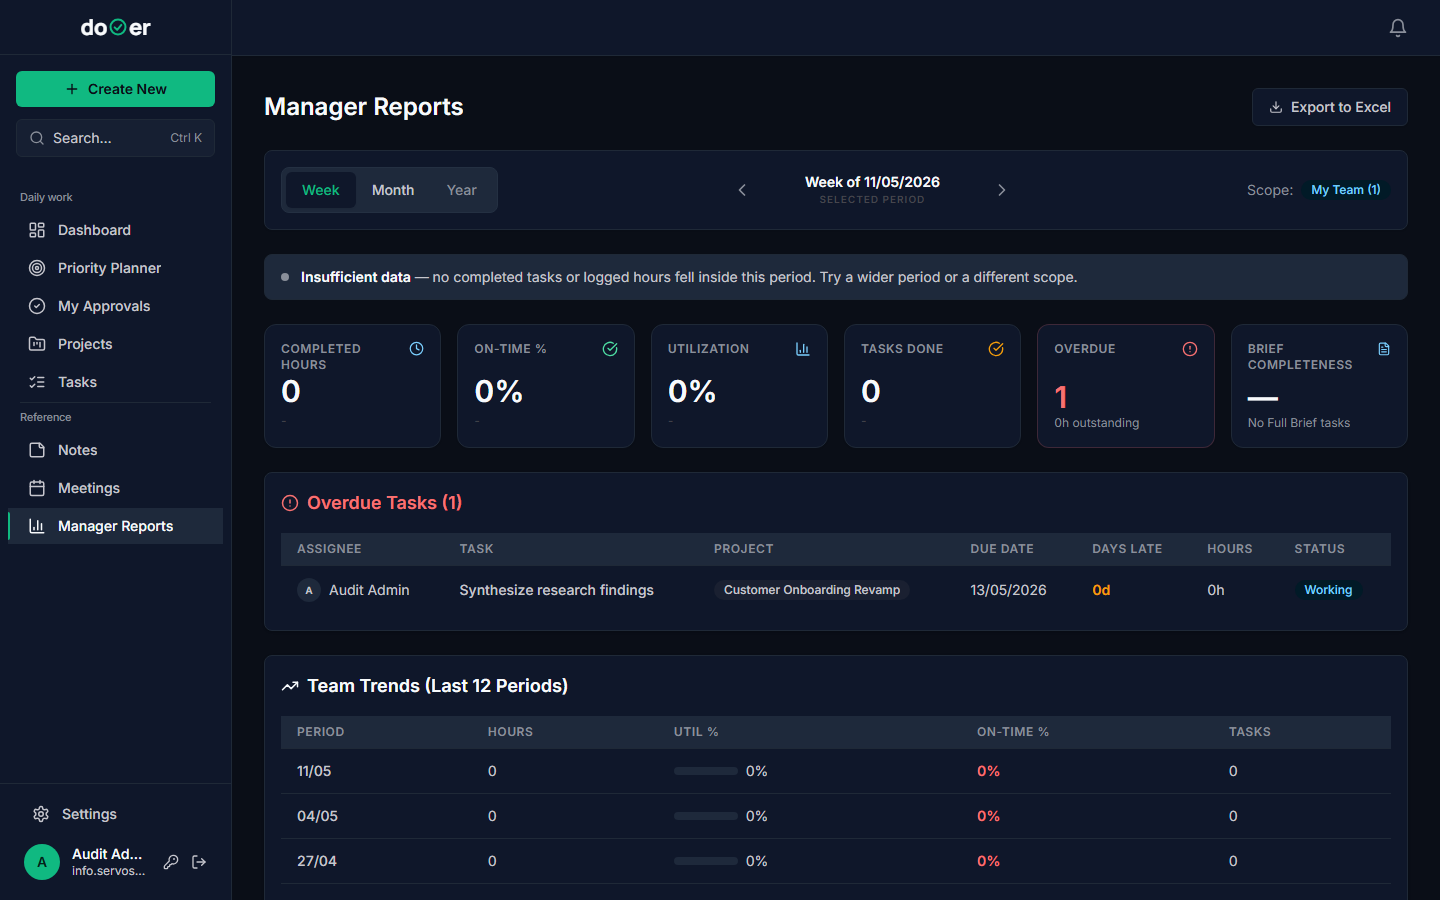
The top of the page shows three team-level KPIs for the selected period:
| Tile | What it counts |
|---|---|
| Overdue | Tasks past their due date that are not yet complete |
| In Progress | Tasks currently in a working status |
| Completed | Tasks marked done within the period |
Below the KPIs, a period navigator lets you move backward and forward — one week or one month at a time, depending on the granularity selector next to it. The current period label sits between the two arrows. Switching the period recalculates all numbers instantly; nothing reloads.
Below the period navigator, a scorecard row shows each team member side by side. Each card shows that person's overdue count, in-progress count, and completed count for the same period. If a card looks different from the rest — more overdue, fewer completed — that's where the conversation starts.
This is the view to open when someone asks "how's the team going?" It gives you the answer in under ten seconds.
The Member Detail view
Click any team member's scorecard to drill into their individual view.
The Member Detail view uses the same period navigator — same granularity, same prev/next arrows — so the period you were looking at on the Team Dashboard carries over. You're not starting over; you're zooming in.
This view shows:
- Their overdue tasks — title, due date, how many days overdue
- Their history — task-level detail across the selected period
- Their completed work — everything they closed out within the period
Use this view when you're preparing for a one-on-one. Before the meeting, open the person's Member Detail, set the period to the last month, and you have a factual starting point — what they finished, what slipped, and what is still open and late. The conversation becomes specific before it starts.
To go back to the full team, use your browser's back button or click Manager Reports in the left sidebar again.
Excel exports — two workbooks
Both views have an Export to Excel button in the top-right corner of the page. Each export produces a .xlsx workbook with four sheets.
Team Dashboard workbook — four sheets:
| Sheet | Contents |
|---|---|
| KPIs | One summary row: period, granularity, completed hours, tasks done, overdue count, overdue hours |
| Overdue | One row per overdue task: title, assignee, due date, days overdue, impact score |
| Trend | Rolling 12-period history for the team: tasks done, completed hours, overdue count per period |
| Scorecards | One row per team member: their KPIs for the current period side by side |
Member Detail workbook — four sheets:
| Sheet | Contents |
|---|---|
| KPIs | One summary row for the selected member: period, completed hours, on-time %, overdue count |
| Overdue | That member's current overdue tasks |
| History | Rolling 12-period history for that member |
| Completed | Every task they completed in the selected period |
Both workbooks are watermarked. Row 1 of the KPIs sheet reads: Confidential — Created by [your name] at [timestamp] — Organization: [org name]. This is there for Greek DPA / GDPR hygiene — the file carries provenance no matter where it travels.
Both exports are audited. The moment you click Export, dooer logs a REPORT_EXPORTED entry in the audit trail — your user ID, which view you exported, the period, and the number of rows written. The audit entry is recorded before the file downloads, so even if the download fails, the intent is on record. You can review these entries in Settings → Audit Log.
Who can see what
Reports is role-gated. What you see on screen — and what ends up in a workbook — depends entirely on your role and where you sit in the reporting hierarchy.
| Role | What Reports shows |
|---|---|
| Member | Your own performance data only. No team view, no scorecards. |
| Manager / Head / Director | Your direct reports, plus every person who reports to those reports — the full subtree, recursively. |
"Recursively" matters. If you manage three team leads who each manage five people, your Team Dashboard shows all fifteen people plus the three leads. You do not need to be anyone's direct manager to see them — you only need to be above them in the reporting chain.
Nobody sees outside their chain. If two managers at the same level run separate teams, neither can open the other's reports or export the other's team data. The RBAC filter runs on the server before the page loads and again before every export row is written. There is no way to export a person you don't manage.
What's next
Working with your team → How to assign tasks, review pending acceptances, and track what your team has committed to.
Your daily flow → How the Dashboard and Priority Planner answer "what am I actually doing today" — the personal complement to the team view you just read about.